Sales analytics: types, methods and metrics
Sales analytics is a regular review of deals, calls and chats that shows whether the plan is on track and at which step the money slips away. To set it up, make your funnel match the real process, make source, amount and loss reason mandatory, and check plan vs. actual by channel and manager every week.
What sales analytics is and why you need it
Sales analytics is a regular review of deal data. Where the leads came from, how many of them reached payment, who handled them and why the rest said no. It answers the boss's two questions: whether we'll hit the plan this month and at which step the money slips away.
Monday, team meeting. The boss opens the report: revenue for last month is almost on plan, everyone is happy. A month later revenue drops, and nobody can explain why. The answer had been sitting in the CRM all along. There were fewer leads from Avito, and one manager's conversion from measurement visit to contract had been falling for the third month in a row. The revenue report didn't show any of this.
Revenue is the result. Analytics shows what it's made of: which channels, stages, managers and services pull it up and which drag it down. When you see this every week, the boss still has time to fix the month before it ends.
This is usually why companies buy a CRM in the first place. According to CNews from February 2026, in a J'son & Partners Consulting survey 60% of respondents named the need for analytics as the main reason to implement a CRM. And 54% of micro-business executives and owners personally monitor sales in their CRM.
A CRM doesn't give you analytics on its own. If fields are left empty and the funnel stages don't match how you actually sell, the reports paint a pretty and wrong picture.
Types of sales analysis
Types of analysis differ by the question they answer. Start with plan vs. actual and the funnel; add the other breakdowns later.
Illustrative example: the channels, stages, manager names and sand levels are made up. The questions for each type of analysis come from the table in the article. Start with plan vs. actual and the funnel, and add the other breakdowns later.
Plan vs. actual
Compares actual revenue and number of deals with the plan for the same date. The month's result matters, but watch the pace too. If by mid-month the actual is clearly behind, the month can still be saved. In the last week it's already too late. Set the plan per manager and per service, otherwise it's unclear whose miss it is.
Funnel analysis
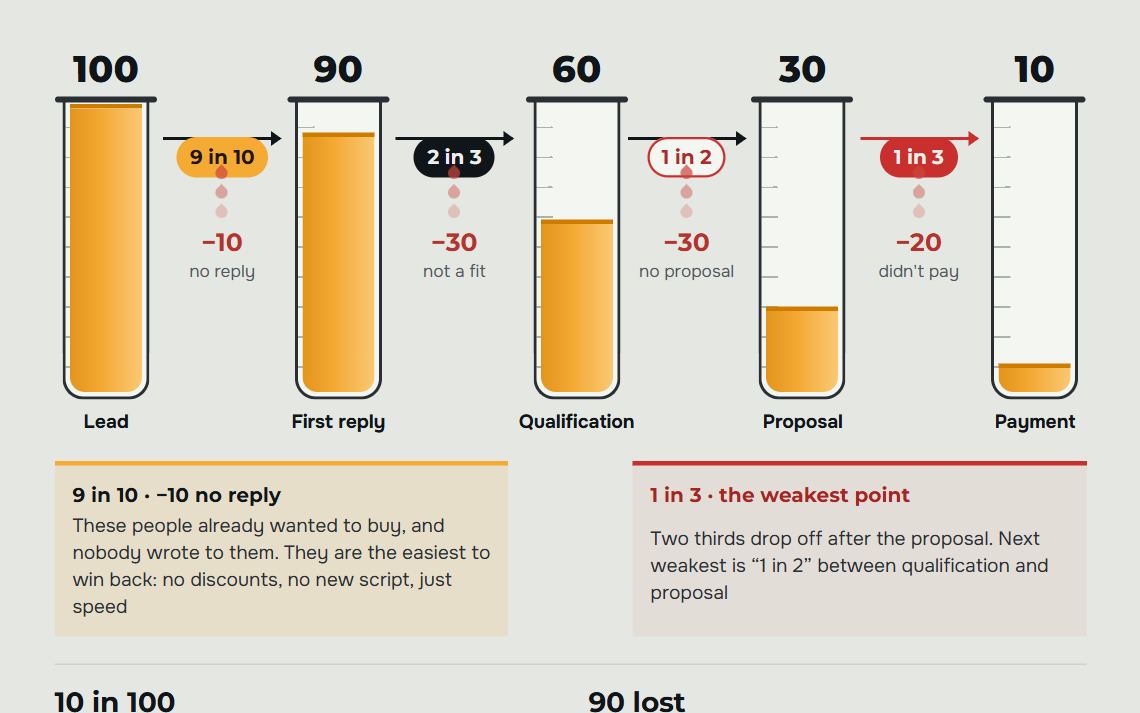
Shows the conversion of each stage: from lead to qualified, from meeting to proposal, from proposal to payment. The stage where conversion drops sharply is where you lose money. We covered how to build the stages and calculate their conversion in amoCRM in detail in our article on the sales funnel.
Channel analysis
Website, Avito, Telegram, WhatsApp, inbound calls, referrals. For each channel, look at the number of leads, conversion to payment, average deal value and customer acquisition cost. Often the noisiest channel brings lots of leads and little money. Quiet referrals behave exactly the opposite way.
Analysis by manager
Compares managers on a similar flow of leads: conversion, average deal value, first response time, number of stalled deals. A manager's revenue on its own says little. Someone handling inbound website leads has an easier time selling than someone cold-calling a database.
Analysis by product and service: ABC and XYZ
ABC analysis splits the range by contribution to revenue or profit. Group A is the few items that bring in most of the money. B is the middle. C is the long tail: it takes up managers' time and warehouse space but brings in almost no money.
XYZ analysis looks at how stable demand is. X sells steadily every month, Y fluctuates with the season, Z is bought now and then. Together they form a matrix. AX is the backbone you can't afford to lose. CZ items are candidates for removal from the price list or for selling to order only.
Illustrative example: the items and monthly sales are made up. The meaning of the groups and the two decisions, “always keep” for AX and “to order only, or drop it” for CZ, come from the article.
Sales cycle analysis
How many days pass from lead to payment, and at which stage a deal sits the longest. If deals sit at “Proposal sent” for weeks, managers aren't getting back to the client after the proposal. A long cycle also pushes money into next month, making plan vs. actual look worse than it is.
Loss reason analysis
Why the lost deals were closed. It only works if the reason is picked from a short list: too expensive, chose someone else, timing didn't suit, couldn't reach them, changed their mind. When most losses are logged as “Other”, the report is empty.
| Type of analysis | What question it answers | What the CRM needs to have |
|---|---|---|
| Plan vs. actual | Will we hit the month's plan in time | Plan per manager and service, payment amounts and dates |
| By funnel | At which stage we lose clients | Stages matching the real process, stage change history |
| By channel | Which channel brings money, and which only brings leads | Source in every deal, ad spend |
| By manager | Who loses deals, and at which step | Assigned manager, tasks, response time |
| ABC and XYZ | Which products and services feed the company | Product or service in the deal, amount, date |
| By sales cycle | Where deals get stuck, and how long the money waits | Date of entry into each stage |
| Loss reasons | Why clients leave | Mandatory reason from a list when closing |
Sales analysis methods
A type of analysis tells you which slice to look at: channels, stages, managers, products. A method tells you how to calculate. The same slice by channel can be compared with last month, broken down into shares or analysed by factors.
| Method | How it works | When to use |
|---|---|---|
| Trend (period over period) | Compares a metric with a previous period: month over month, year over year | To see growth, decline and seasonality. Compare like with like: March with March of last year |
| Structural | Calculates the share of each part in the total: channels, services, managers, customers in revenue | To understand what revenue rests on and whether it depends on a single channel or customer |
| Control (plan vs. actual) | Compares actuals with the plan for the same date | Every week, while the month can still be saved |
| Factor analysis | Breaks revenue down into multipliers: leads, conversion to payment, average order value | When revenue has changed and you need to know which multiplier moved it |
| ABC and XYZ | Splits the range by contribution to revenue and by how steady demand is | Once a quarter, to decide what stays in the price list and what is sold to order only |
| RFM | Splits customers by recency of last purchase, frequency and amount spent | For repeat sales: whom to win back and whom to offer more |
| Cohort analysis | Tracks groups of customers who came in the same month | To see whether customers come back and which channel brings those who buy again |
| SWOT and expert assessment | The head of sales and the team assess the strengths and weaknesses of sales | For strategy when numbers are scarce. Conclusions are then checked against data |
Factor analysis: why revenue changed
Revenue equals the number of leads multiplied by conversion to payment and by average order value. When revenue drops, look at which of the three multipliers sagged. Each has its own owner and its own fixes.
- Fewer leads. A question for advertising and channels: which channel dropped and since which week.
- Conversion fell. A question for the sales team: at which funnel stage and with which manager customers are lost.
- Average order value went down. A question for the range and discounts: you are selling more cheap items, or managers give in on price more often.
This calculation takes half an hour in any spreadsheet. Afterwards it is clear whom to call to the review: the marketer, the head of sales or whoever owns pricing.
RFM and cohorts: what happens to customers after the first purchase
These methods are needed where a customer buys more than once: retail, services with repeat visits, supplies of consumables. RFM shows who has not bought for a long time and whom to win back. Cohorts show how many customers from each month came back for a second purchase.
If your deals are one-off, like glazing a balcony, start with the funnel and channels. Come back to RFM and cohorts once the CRM has built up a history of repeat purchases.
Sales metrics: what to track and how
To start, the metrics in the table below are enough. One rule matters: each one is calculated the same way month after month and taken from one source. Otherwise you'll be comparing different things and arguing about numbers instead of acting.
| Metric | How it's calculated | What it shows | Where to get it |
|---|---|---|---|
| Plan completion | Actual to date divided by plan to date | Whether you'll close the month in time | CRM, plan per manager |
| Revenue | Total of paid deals for the period | The result of the work, but not its causes | CRM, accounting system |
| Number of leads | All new enquiries for the period across all channels, without duplicates or spam | The team's workload and how the ads perform | CRM with connected channels |
| Stage conversion | Deals that moved to the next stage divided by deals that entered this one | Where the funnel loses clients | CRM, stage history |
| Conversion to payment | Paid deals divided by all leads for the period | Overall sales strength | CRM |
| Average deal value | Revenue divided by the number of paid deals | What drives revenue changes: number of clients or purchase size | CRM, accounting system |
| Customer acquisition cost | Channel spend divided by the number of paying clients from it | Which channel pays off | Ad accounts and CRM |
| Sales cycle | Average number of days from lead to payment | Sales speed and money shifting between months | CRM, stage dates |
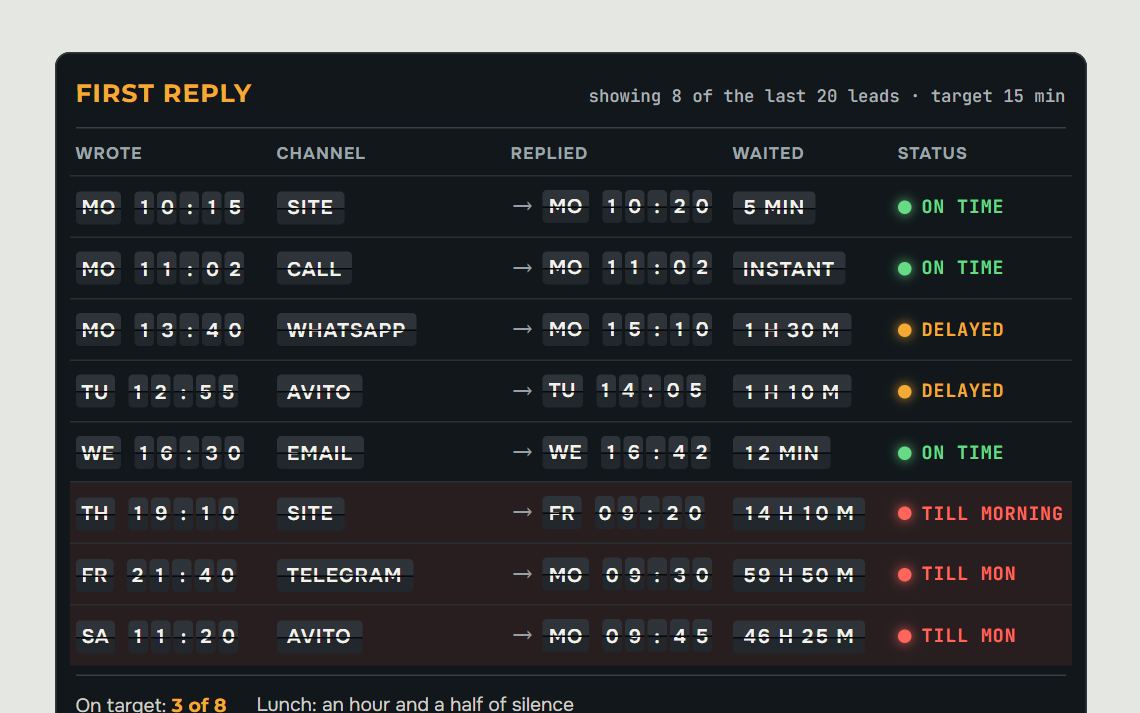
| First response time | From the lead coming in to the manager's first reply | How many leads go cold while waiting | CRM, telephony, messengers |
| Share of losses by reason | Losses with this reason divided by all losses | What exactly puts clients off | CRM, review of calls and chats |
| Stalled deals | Open deals with no task, or with no movement for longer than the usual cycle | Money lying around unattended | CRM |
| Repeat purchases | Clients who bought more than once divided by all clients | Whether clients come back to you | CRM, accounting system |
Look at metrics in pairs. Revenue went up but average deal value went down: you're selling more cheap stuff, and profit may fall. Leads went up but conversion to payment dropped: the ads brought the wrong people, or managers can't keep up with replies.
Where to get data for sales analysis
The data sits in several places, and each holds its own piece of the truth.
- CRM. Deals, stages, amounts, dates, source, manager, loss reason. The basis of every report, if the fields are filled in honestly.
- Telephony. All calls with recordings: who called, how long they waited, who never got a call back. A missed call with no deal in the CRM is a lost lead that no report will ever see.
- Chats. Telegram, WhatsApp, Avito, website chat. This is where the client says in their own words what they're unsure about and what didn't suit them.
- Accounting system and ad accounts. Payments, shipments, cost of goods, ad spend. Without them you can't calculate profit or customer acquisition cost.
Thursday evening. A client messages a manager on WhatsApp at their personal number: “Found it cheaper, thanks.” In the CRM the deal hangs at “Thinking it over” for another three weeks, then gets closed with the reason “Other”. The truth stayed in the manager's phone. Hence rule number one: all channels are connected to the CRM, and every touchpoint lands in the deal card.
Illustrative example: the deal, call, timings and notes are made up. The line “Found it cheaper, thanks”, the Avito dip and the manager whose measurement-to-contract conversion has been falling for the third month come from the article. The summary arrives once a week; a dip alert arrives the same day.
How to set up sales analytics in amoCRM and Bitrix24
The built-in reports are enough to start. In amoCRM that's the “Analytics” section: sales analysis, summary report, employee report and goals. In Bitrix24 it's reports and analytics in the CRM section. The setup order is the same in both systems.
- Write down your questions. What the boss wants to know every week: are we hitting the plan, which channel has dipped, which managers are losing deals. A report that doesn't answer a specific question never gets opened.
- Make the funnel match the real process. Each stage is a client or manager action with a clear condition for moving on: “Measurement booked”, “Proposal sent”, “Invoice issued”. An “In progress” stage won't show conversion.
- Make the key fields mandatory. Source, product or service, amount, loss reason. The reason comes only from a list, no free text. Both CRMs can require a field when a deal moves to a stage: not filled in, not moved.
- Connect channels and telephony. Calls, Telegram, WhatsApp, Avito and website leads should create deals automatically with the source marked. Otherwise the channel breakdown will be pieced together from memory.
- Set the plan. By manager and month, by revenue and number of deals. amoCRM has goals for this, Bitrix24 has a sales plan in CRM analytics. How to link the plan to the forecast for open deals is covered in the next section.
- Clean up the database. Merge duplicates, close dead deals with a reason, fill in the source where it's missing. Without this, the first reports will show a mess instead of a picture.
- Assemble a set of reports. Plan vs. actual, funnel with stage conversion, breakdowns by channel and manager, loss reasons, stalled deals. Five reports opened every week are more useful than a thick folder nobody opens.
- Set a rhythm. Once a week the boss looks at the summary and, for each deviation, sets a task with an owner and a deadline. Once a month: a review by product, channel and loss reason.
Checking the setup is simple. Take any lost deal from last week and try to answer from its card: where the client came from, what they wanted, who handled them and why they left. If there's no answer, reports on deals like that won't tell you anything either.
Sales plan and forecast in the CRM: why the forecast lies
Plan, actuals and forecast are three different numbers. The plan is what you need to sell. Actuals are what has already been paid. The forecast is the expected outcome of open deals. An open deal is not yet a sale, even if the manager is sure of the client, so the report keeps these numbers separate.
Split the plan by the dimensions you actually manage: managers, services, channels. Decide in advance who gets credit for a deal if two people handled the client, and where a deal that slipped into the next month belongs. Don't split the plan finer than your records allow. If the source field is often empty, a plan by channel will only look precise on screen.
The forecast is built on the amounts and close dates of open deals. Don't make the manager guess the amount from the client's first message: agree at which stage it appears and by what rule it is refined. Otherwise the forecast rests on guesses from day one.
The forecast most often lies for two reasons:
- Dates. The close date is set when the deal is created and never touched again. A month has passed, and the deal still “closes on the 30th”.
- Dead deals. Deals that nobody closed as lost hang in the pipeline and pull the forecast up. You need a rule: no movement for longer than the usual cycle means close with a reason or set a new step.
Checking the forecast takes half an hour. Open the deals that make up a noticeable part of the expected amount and answer for each one: is there a live contact, is the request clear, is a next step set. This separates confirmed agreements from hopes. If the forecast is below plan, don't touch the plan until you find the cause with the factor analysis above.
Tools for sales analytics
Choose a tool based on where your data lives and how many sources you have. A spreadsheet or the CRM's built-in reports are enough to start. A BI system and AI are needed when there are many sources and no time to merge them by hand.
| Tool | What it can do | Limitations | Who it suits |
|---|---|---|---|
| Excel, Google Sheets, Yandex Tables | Any calculations and pivot tables from an export | Data is exported by hand, the report is outdated the day it is exported, nobody sees copy errors | First calculations and one-off reviews with a small flow of leads |
| Built-in CRM reports: amoCRM, Bitrix24 | Plan vs. actual, funnel with stage conversion, reports by manager and source | They only see CRM fields. Profit and complex slices cannot be calculated | Any sales team that runs deals in a CRM |
| Accounting system, e.g. 1C | Payments, shipments, cost of goods, stock | Knows nothing about leads, stages and loss reasons | Profit calculation, ABC and XYZ by product |
| End-to-end analytics | Links ad spend to deals and payments | If the source in the CRM is empty, the link breaks | Companies that advertise in several channels |
| BI systems, e.g. Yandex DataLens | Combine CRM, accounting and advertising into one dashboard with any slices | Someone has to set up the data feeds and maintain them | Management needs one dashboard across several sources |
| Speech analytics and AI | Review calls and chats, find loss reasons, send an alert when the plan falls behind | Requires call recordings and messengers connected to the CRM | Teams where loss reasons are heard in conversations while the CRM says "Other" |
An expensive tool will not fix empty fields. First make sure every deal has a source, an amount and a loss reason, then decide whether the built-in reports are enough.
Sales analytics mistakes: why you can't see where the money is lost
Looking only at revenue. It lags behind. By the time revenue has dropped, the problem in the funnel happened a month or two ago. Watch leads, stage conversion and stalled deals: they dip earlier.
Filling in fields just to tick a box. Source is empty, loss reason is “Other”, amount is “1”. The manager has no time, and nobody checks. A report built on data like this looks solid and means nothing.
Calculating conversion on junk. Spam, duplicates and supplier calls end up among the leads. Conversion comes out low, and the team gets blamed for nothing. Cut the junk out with a separate stage or a closing reason.
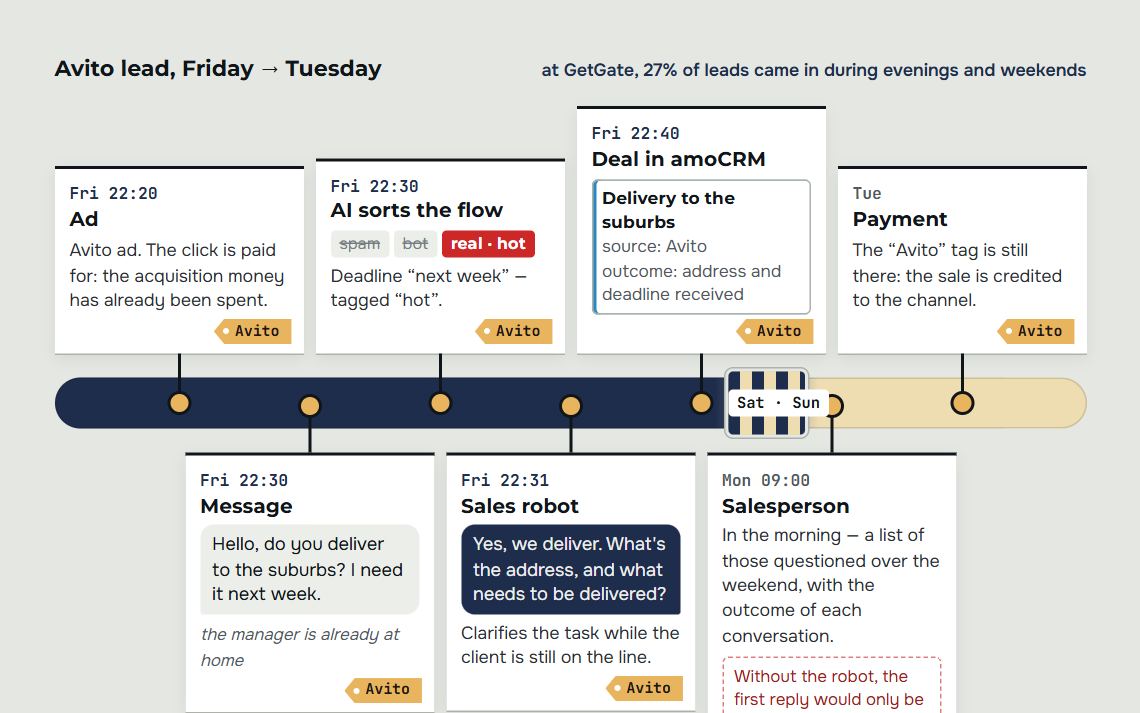
Letting chats bypass the CRM. Managers' personal numbers, a separate Avito account, email. Anything that doesn't get into the CRM doesn't exist for analytics, and those leads are often the warmest.
Looking only at month-end. Reviewing results on the 30th is useful for the record, but the month can no longer be saved. Plan vs. actual is needed every week, and better still every day.
A report, but no action. At the team meeting everyone sees the dip in a channel, nods and leaves. Every deviation should end with a task: who does what, and when we check.
How AI helps analyze sales
CRM reports only see what the manager put into the fields. The real reasons for losses are heard in calls and chats, and nobody listens to all of them: the boss spot-checks a few conversations a week. AI goes through all of them.
Tuesday, a call. The client says: “We messaged you on Friday, you only replied on Monday, we've already ordered elsewhere.” The manager closes the deal with the reason “Too expensive”. The report will show a price problem that doesn't exist. AI, having analyzed the conversation, attributes the loss to the slow reply, and an honest line appears in the summary.
- Finds loss reasons that aren't in the CRM fields. Transcribes calls, reads chats in Telegram, WhatsApp and on Avito, and sorts losses by what the client actually said.
- Looks for fumbled deals. The client was ready, but no next step was set, or the manager went silent after a question about price. We covered how this works in our article on monitoring managers and lost deals.
- Checks conversations against a checklist. Did the manager uncover the need, name the next step, handle the objection? This is the job of call and chat quality control.
- Sends an alert when the plan dips. Every day the system compares actual with the pace needed to hit the plan. If a channel, service or manager falls behind, the boss gets a Telegram message with the reason, without waiting for the end of the month.
In our live GetGate project, AI analyzed more than 1,000 conversations, and the analysis covered more than 500 deals. No boss will ever listen to that many by hand, and that's exactly where the loss reasons hide.
Where to start with sales analytics
Don't wait for a perfect system. Start with what will give you an answer this Friday.
- Write down the questions the boss wants answered every week.
- Check the funnel stages against the real process and remove stages like “In progress”.
- Make source, amount and loss reason (from a list) mandatory.
- Connect telephony and all messengers to the CRM, including managers' personal numbers.
- Set a plan per manager and check plan vs. actual every week.
- Review last month's loss reasons from conversation recordings, not just from the CRM field.
If you want this to work without manual exports, take a look at how we built AI Sales Profit sales analytics. Real-time plan vs. actual, breakdowns by channel, service and manager, revenue forecast, dip alerts and a weekly summary for the owner. How analytics works together with the sales robot and quality control is described in our breakdown of implementing AI in business.
Frequently asked questions.
What is sales analytics, in simple terms?
It's a regular review of how you sell: where leads come from, how many of them reach payment, who handles them and why the rest say no.
Revenue only shows the result. Analytics shows what it's made of and at which step the money is lost, while the month can still be fixed.
Which sales metrics should you track first?
Start with plan completion to date, number of leads, conversion at each funnel stage, average deal value and loss reasons.
These metrics are enough to see where sales are sagging. Add customer acquisition cost by channel, sales cycle and repeat purchases once the first metrics are calculated without manual reconciliation.
Which sales analysis methods are used most often?
The most common are plan vs. actual, period-over-period trend analysis, structural analysis of revenue shares, factor analysis and ABC/XYZ for the product range.
If customers buy repeatedly, RFM and cohort analysis are added. It is best to start with plan vs. actual and the funnel: they show fastest where money is lost.
Can you set up sales analytics with the built-in reports in amoCRM or Bitrix24?
Yes, the built-in reports are enough to start: sales analysis, employee report, funnel with stage conversion, sales plan.
The main work is in the data. Funnel stages must match the real process, source, amount and loss reason must be mandatory, and all channels and telephony must be connected to the CRM. Without this, reports will be accurate in form and wrong in substance.
How often should you look at sales analytics?
Plan vs. actual every week, and with a short sales cycle every day. A review by product, channel and loss reason works well once a month.
Action matters more than frequency. Every deviation spotted in a report should end with a task that has an owner and a check date.
How does AI help with sales analytics?
AI goes through every call and chat in full and finds what isn't in the CRM fields: the real loss reasons, fumbled deals, a missed next step.
It also compares actual with plan every day and sends the boss an alert if a channel, service or manager is falling behind. The decision on what to change stays with a human.
Let's audit your business
Leave a request and on a free consultation we'll find where customers are being lost, suggest which service to start with and price it around your goal.
Rather not fill in a form? Message our agent on Telegram — it replies right away and books you a review.